Stacks (STX) extends the Bitcoin (BTC) blockchain with smart contract capability. Through the process of “stacking”, holders of STX can earn BTC without buying an actual BTC miner and consuming vast amounts of electricity on a daily basis. In stacking, you are locking your STX temporarily to support the network’s security and consensus. In return, you earn the bitcoin miners transfer as part of proof-of-transfer protocol. STX is basically used as fuel for smart contract execution, transaction processing, and digital asset registrations on the Stacks blockchain, which bridges the Bitcoin (BTC) blockchain and takes advantage of its security features.
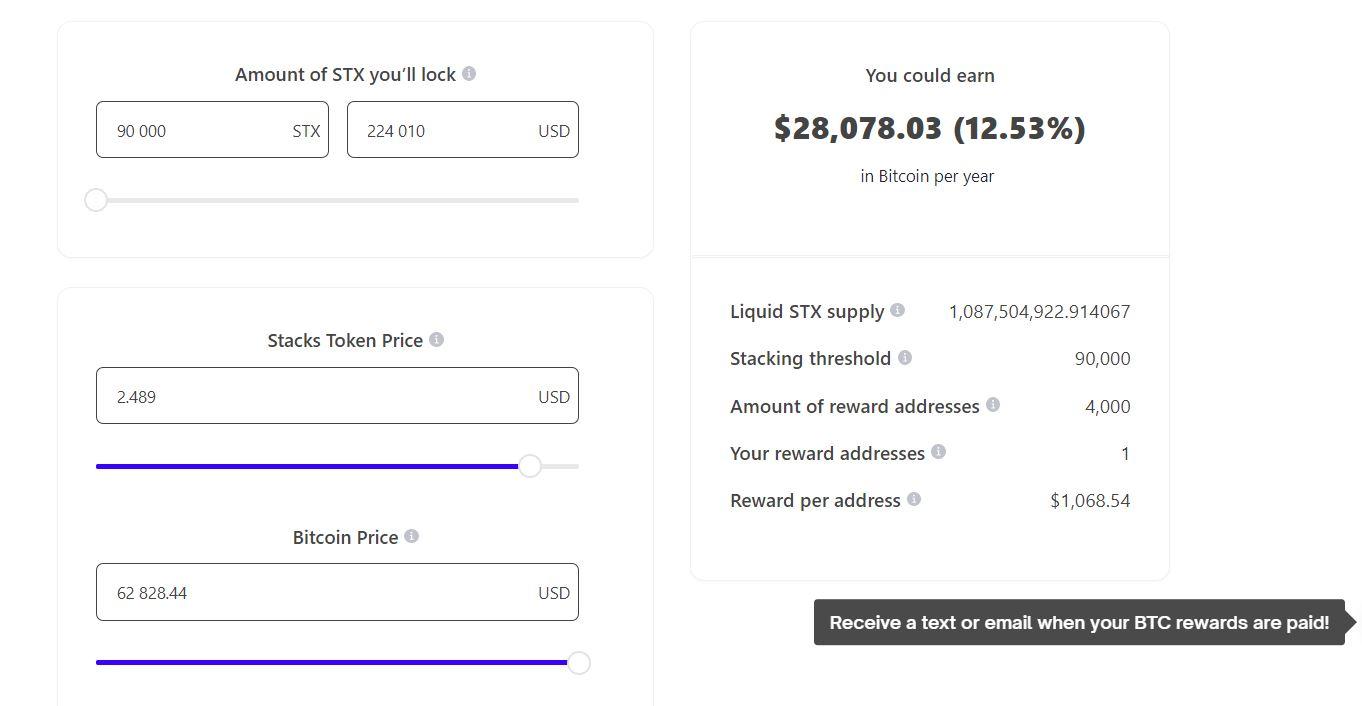
Without getting into the technical details too much, let’s first take a look at how the yield is calculated based on a model posted online in the Stacks Foundation website stacks.org. Assuming a current price of STX being $2.489 and a current price of BTC being $62,828.44, the “mining” yield on BTC is estimated to be 12.53%.
You can learn more about the economic models in this blog post from the organization:
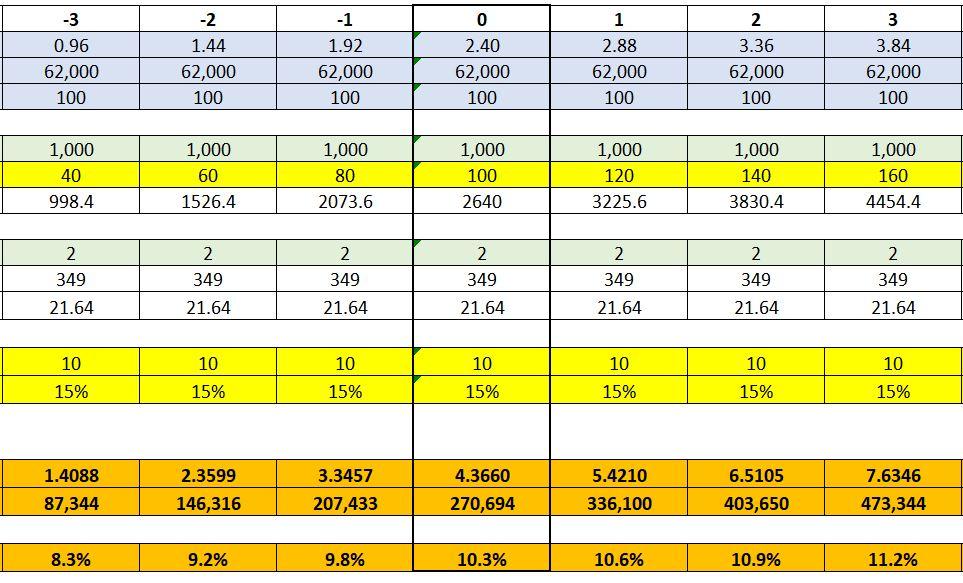
In the blog, it contains an economic model in Excel for you to play around with different parameters and conduct scenario analyses. We download the excel template and plug in the default parameters and an assumed price of STX of $2.40 and an assumed price of BTC of $62,000. The excel model provides an estimated mining yield of 10.3% with the default parameters provided by the excel template creator.
We try out the model with some sensitivity analyses on the prices of STX and BTC. First, fixing the BTC price to be constant at the level of $62,000, we vary the price of STX from 0.96 to $3.84 with the mid-point of $2.40. The estimated yield using the model changes from 8.3% to 11.2% as the price of STX increases.
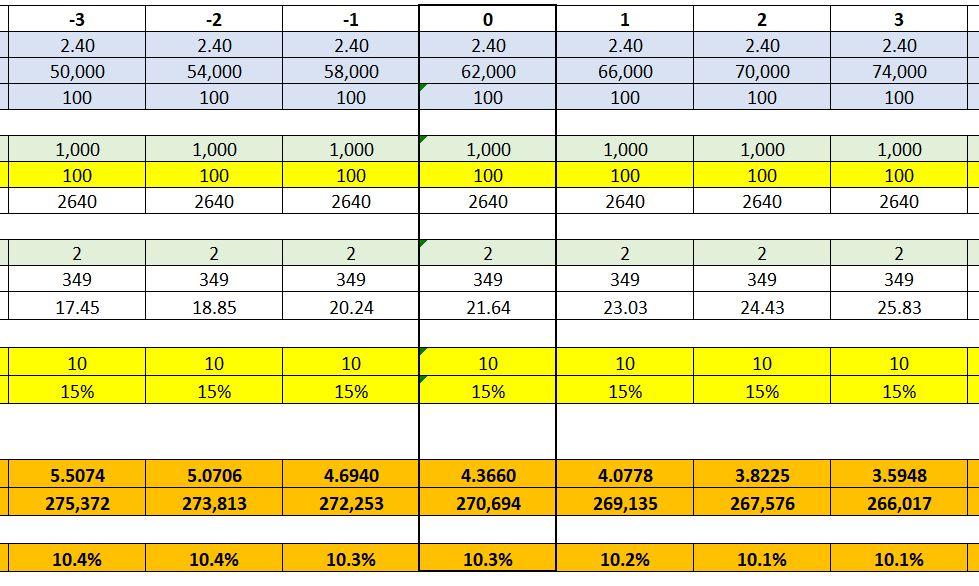
Next, fixing the STX price to be constant at the level of $2.40 and fixing the STX transaction fee to be $100, we vary the price of BTC from $50,000 to $74,000 with the midpoint of $62,000. The estimated yield using the model changes from 10.4% to 10.1% as the price of BTC increases.
Is the economic model described by the model realistic? We believe that the model is too simplistic and relies on too many static assumptions. The actual pricing is a much more dynamic process with many moving pieces.
At the high level, the stacking economic model functions like a two-sided market. On one side, there are STX holders stacking STX to earn BTC. On the other side, there are STX miners mining STX using BTC. Assuming players on both sides are rational, they will be making decisions based on the expected yields from stacking STX to earn BTC or using BTC to mine STX. In the ideal case, there will be positive feedback that drives up the value of STX and BTC as the stacks ecosystem is more developed. We observe initial momentum for this positive feedback but much still needs to be proved through time.
The problem with this excel economic model is that it makes many assumptions on a variety of parameters and treats them as exogenous. But in fact, almost all of them are endogenous and depend on the other parameters. Take the price of STX as an example. The model treats the price of STX as exogenous. In addition, the prices stay constant at the assumed level for the entire year when the excel template calculates the annualized yield.
In reality, the price of STX is endogenously determined by other factors in the model. We may be treating the price of BTC as more exogenous to the model but definitely not the price of STX. In the long run, we believe that the price of STX will be priced based on the expected yield on BTC. Market participants will be pricing STX based on the expected return, which can range from 6% to 13% in the market currently. The numbers are related to the current APY from HODL BTC in an interest-bearing account and DeFi protocols.
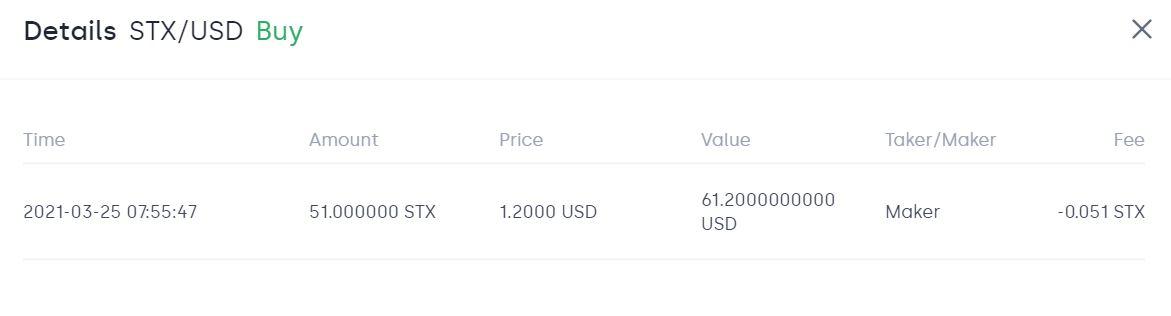
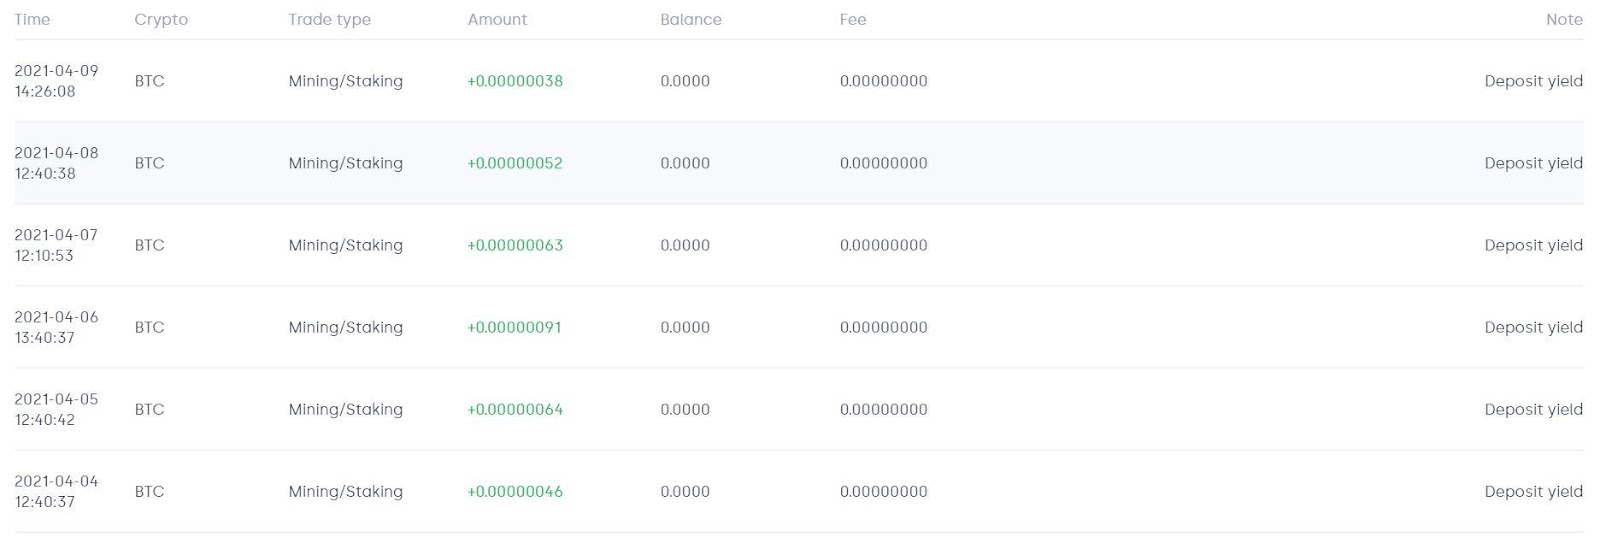
Finally, let’s toss the oversimplified Excel economic models aside and look at it using realized data points. One of our members has stacked 50 STC on OKCoin for one stacking cycle. Let’s how the numbers work. In late March, the member bought 50 STX at the price of 1.20 USD and put it in the stacking protocol. This equates to an initial investment of 61 USD (60 USD + Fee).
The member started to earn BTC from March 28 to April 9 in the upcoming stacking cycle. Each day, the member receives 0.00000027 BTC to 0.00000091 BTC as stacking rewards. This amounts to a total of 0.00000673 BTC in 13 days, which equates to 0.00000052 BTC reward per day on average. However, there appears to be no reward for two days between two stacking cycles. In other words, the total reward of 0.00000673 BTC should be a 15-day period. Assuming the current price of BTC to be 63000, the annualized yield from 50 STX stacking is 0.00000673/15*365*63000/61= 16.9%.
Note that the yield is calculated using the initial investment on STX before the stacking cycle. The price of STX has gone up 100% from 1.20 to over 2.40 currently. If the BTC reward is staying the same, the yield from stacking STX will be halved to 8%-9%. But based on the economic model, BTC reward may increase as the price of STX goes up. At this point, we need to wait until another stacking cycle to see if there are sustained increases in BTC reward as prices of STX goes up (as predicted by the model).
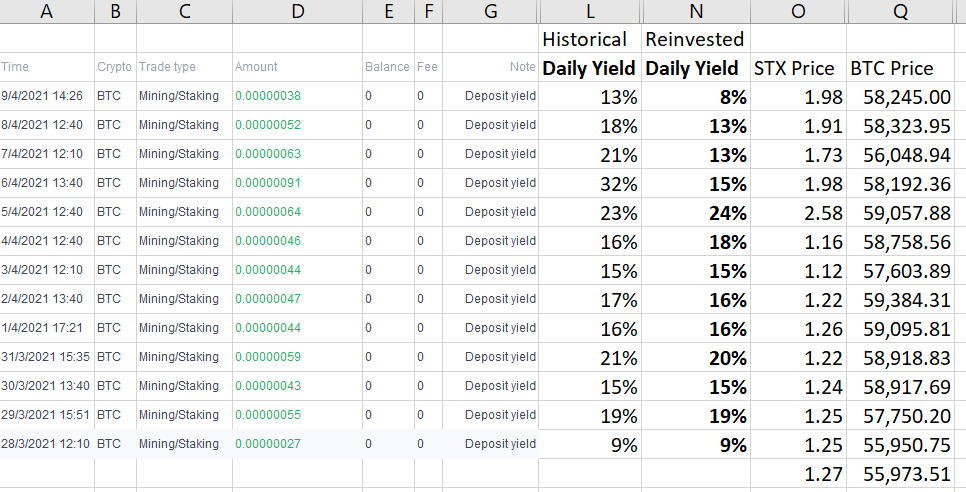
We may get some hints from the daily data instead of looking at the yield per stacking cycle. Column L in the following chart lists the daily yield based on the historical investment cost of 50 STX at $1.20 each and the current BTC price of $63,000. This is the realized annualized yield that the member is getting if the BTC reward has been kept and liquidated today. Suppose if the BTC reward was liquidated to USD each day and we are calculating the STX yield on a rolling basis at the daily level (using the last day’s STX closing price as the denominator), column N lists the realized STX yields on a daily basis.
From both calculations, one can see that the yield and STX price appears to be positively correlated to some extent, though far from a perfect positive correlation. However, it’s unclear which direction the causality goes. As we said, there may be a positive feedback loop on this, with bi-directional causality. With sufficient data points, we can run deeper analyses using regression to understand the relationship better, along with various other data points.
Comments
Post a Comment